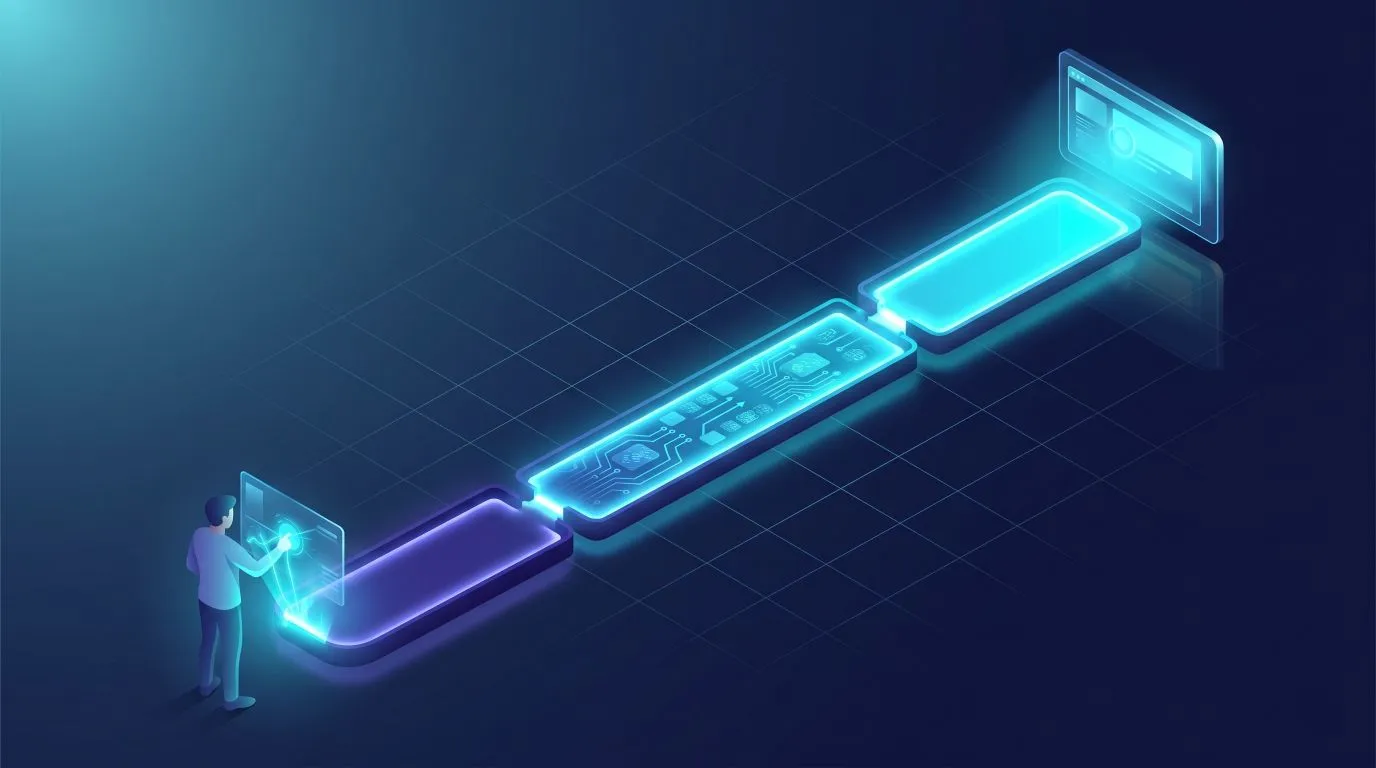
Drive the field p75 of Interaction to Next Paint (INP) below the 200 ms 'good' threshold on a production web app. This runbook is for frontend engineers who already ship to real users and have a page failing the INP assessment in Chrome User Experience Report (CrUX) data.
INP replaced First Input Delay as a Core Web Vital on March 12, 2024. Unlike FID, it scores every interaction across the page lifecycle, not just the first one, so a single slow handler buried in a long session can fail the page. You will instrument real-user attribution, isolate the slow phase of one interaction, fix it, and confirm the field metric moves.
Prerequisites
- Node.js 20+ and a package manager (npm, pnpm, or Bun)
- A production page already collecting CrUX field data, or enough real traffic to run RUM
- Chrome 123+ for the Long Animation Frames API and DevTools Performance panel
- A CrUX API key (free) for scripted baseline reads
- Deploy access plus a feature flag or staged-rollout mechanism
- An analytics or RUM endpoint that can ingest beacons
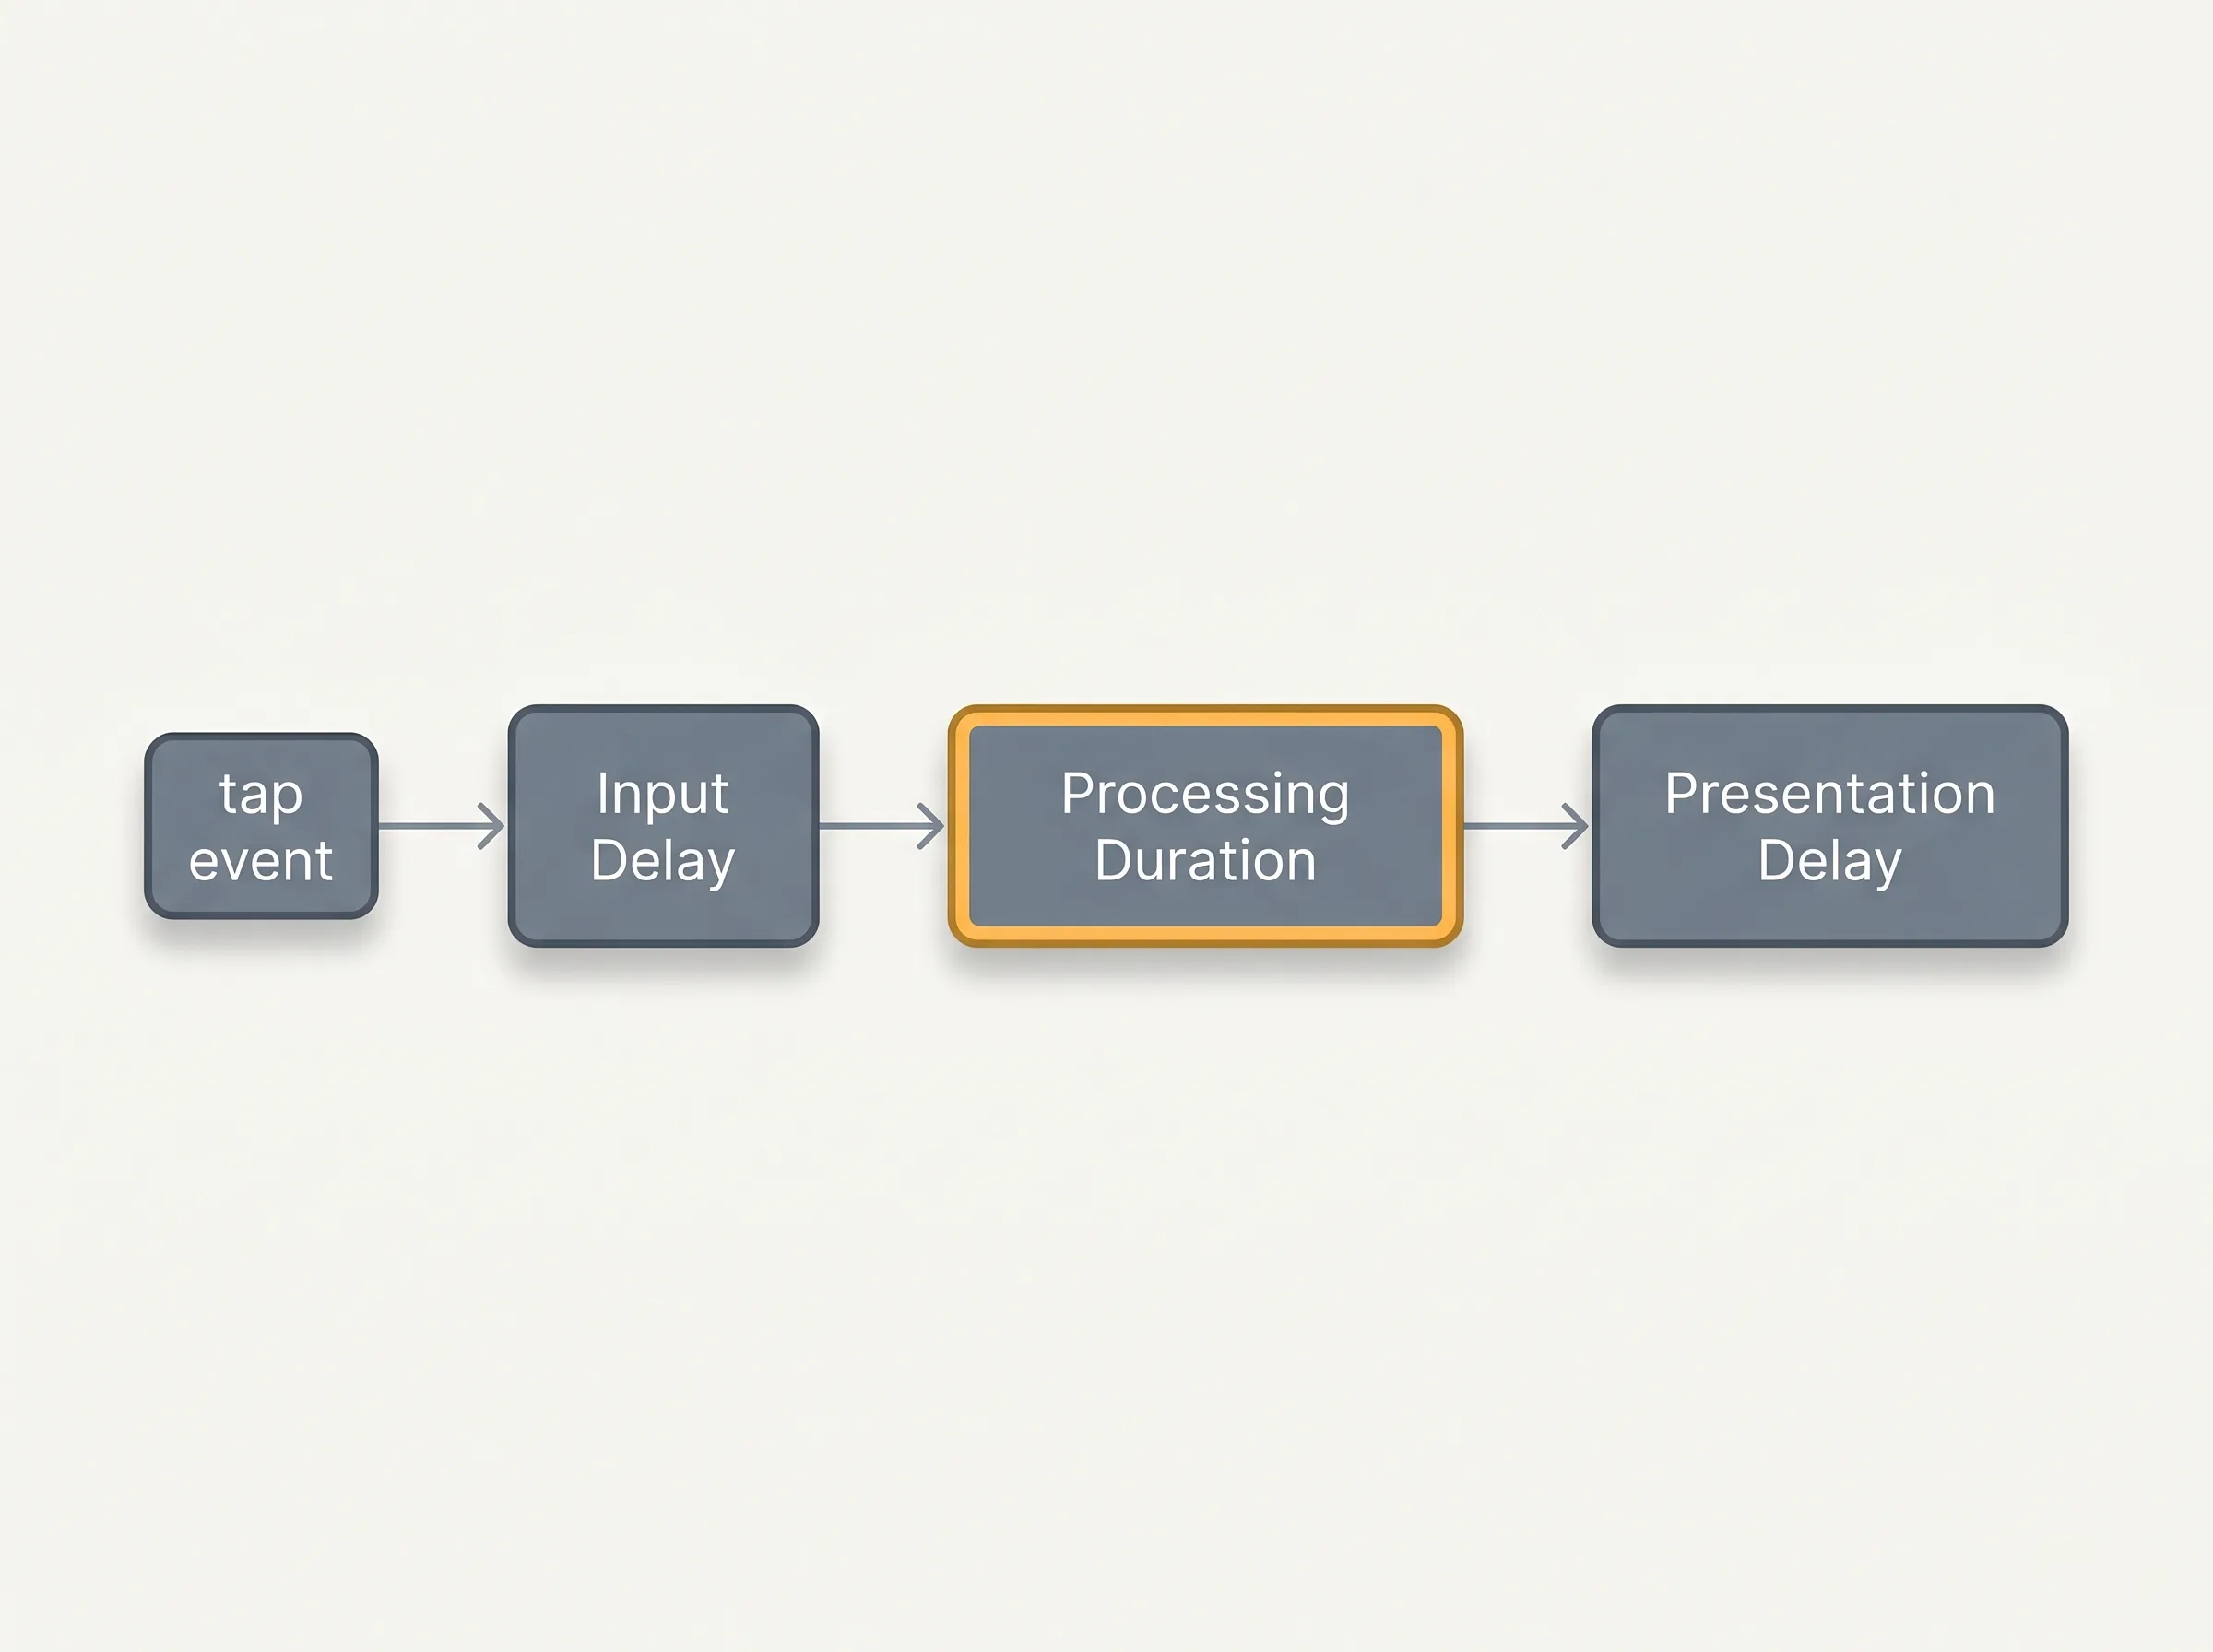
An interaction breaks into three phases. Input delay is the time before any handler runs. Processing duration is how long your event listeners take. Presentation delay is the gap between the last callback finishing and the browser painting the next frame. INP is the longest interaction the page sees, with an outlier allowance on pages with many interactions. Fixing it means finding which phase dominates, then attacking that phase. The steps below follow that order: baseline, instrument, reproduce, attribute, then one fix per phase.
Step 1. Establish a field baseline
Capture the current p75 INP from real users before changing anything, so you can prove the fix later.
# Reads the trailing 28-day p75 for the URL from CrUX field data
curl -s "https://chromeuxreport.googleapis.com/v1/records:queryRecord?key=$CRUX_API_KEY" \
  -H 'Content-Type: application/json' \
  -d '{"url":"https://example.com/checkout","metrics":["interaction_to_next_paint"]}' \
  | jq '.record.metrics.interaction_to_next_paint.percentiles.p75'
Expected result:
- A p75 value in milliseconds. Above 200 means the page needs work; above 500 is 'poor'.
- If the response is empty, the URL lacks enough CrUX traffic. Fall back to the RUM data from Step 2.
Recovery note: this is a read-only call, nothing to undo.
Step 2. Instrument real-user INP attribution
Collect per-interaction attribution so you know which element and which phase to fix, not just an aggregate number.
npm install web-vitals@5import {onINP} from 'web-vitals/attribution';
onINP(({value, attribution}) => {
navigator.sendBeacon('/rum', JSON.stringify({
value, // total INP for this interaction
target: attribution.interactionTarget, // CSS selector of the element
type: attribution.interactionType, // 'pointer' or 'keyboard'
inputDelay: attribution.inputDelay,
processingDuration: attribution.processingDuration,
presentationDelay: attribution.presentationDelay,
loadState: attribution.loadState,
}));
});Expected result:
- Beacons arrive with a target selector and the three phase durations.
- Aggregate p75 grouped by target. The worst selector is your first fix.
Recovery note: if no beacons arrive, confirm the script loads on the page and that sendBeacon is not blocked, then remove the import to revert.
Step 3. Reproduce the slow interaction locally
Recreate the worst interaction under throttling so you can trace it deterministically.
Run this in the page console to log any interaction whose duration crosses the INP 'good' line, then perform the interaction from Step 2:
new PerformanceObserver((list) => {
  for (const entry of list.getEntries()) {
    if (entry.duration > 200) {
      console.log(entry.name, Math.round(entry.duration) + 'ms', entry.target);
    }
  }
}).observe({type: 'event', durationThreshold: 200, buffered: true});
For the visual breakdown, open the DevTools Performance panel, set CPU to 4x slowdown, record, perform the interaction, then expand the Interactions track. The long bar is your INP event.
Expected result:
- An 'event' entry over 200 ms in the console, plus a matching long bar in the Interactions track.
- At least one long task overlapping the interaction.
Recovery note: read-only observation, nothing to undo.
Step 4. Attribute the bottleneck to a phase
Split the interaction into its three phases and find the exact script responsible, using the Long Animation Frames API (Chrome 123+).
new PerformanceObserver((list) => {
  for (const frame of list.getEntries()) {
    console.log('LoAF', Math.round(frame.duration) + 'ms',
                'blocking', Math.round(frame.blockingDuration) + 'ms');
    for (const script of frame.scripts) {
      console.log('  ', script.invoker, script.sourceURL,
                  Math.round(script.duration) + 'ms');
    }
  }
}).observe({type: 'long-animation-frame', buffered: true});
Read the RUM phase numbers from Step 2 alongside this output:
| Dominant phase | Likely cause | Go to |
|---|---|---|
| inputDelay | A long task is busy when the user acts | Step 5 |
| processingDuration | Heavy synchronous handler or re-render | Step 6 |
| presentationDelay | Large DOM, layout thrash, or costly paint | Step 7 |
Expected result: the console names the script (sourceURL plus invoker) holding the longest blocking time.
Recovery note: LoAF is Chrome-only. In other browsers, rely on the DevTools trace from Step 3.
Step 5. Cut input delay by yielding to the main thread
Break long tasks into chunks and hand control back to the browser between them so a queued interaction can run.
function yieldToMain() {
  if (globalThis.scheduler?.yield) {
    return scheduler.yield();
  }
  return new Promise((resolve) => setTimeout(resolve, 0));
}

async function handleClick() {
  showSpinner();              // immediate, cheap feedback first
  await yieldToMain();        // let the browser paint the spinner
  for (const chunk of workChunks) {
    processChunk(chunk);
    await yieldToMain();      // give pending input a slot between chunks
  }
}
Prefer scheduler.yield(): it resumes work at the front of the queue. It is not Baseline yet, so the setTimeout fallback keeps older browsers working.
Expected result:
- In a fresh trace, inputDelay drops and the handler starts within roughly 50 ms of the event.
- The single long task from Step 4 is now several shorter tasks.
Recovery note: revert the handler to its previous synchronous form to undo.
Step 6. Cut processing time
Keep urgent updates on the critical path and push expensive work off it.
In React, mark non-urgent state updates with useTransition and read derived values through useDeferredValue so typing stays responsive while filtering runs at lower priority:
import {useState, useTransition, useDeferredValue} from 'react';

function Search({items}) {
  const [query, setQuery] = useState('');
  const [isPending, startTransition] = useTransition();
  const deferredQuery = useDeferredValue(query);

  function onChange(e) {
    setQuery(e.target.value);                 // urgent: keeps the input live
    startTransition(() => {
      runExpensiveFilter(e.target.value);     // non-urgent: yields to input
    });
  }

  const results = filterItems(items, deferredQuery);
  return <Results items={results} stale={isPending} />;
}
Debounce listeners that fire on every keystroke or scroll. To cut the re-render cost itself, the React Compiler memoizes components automatically. Shipping less JavaScript up front, for example through islands architecture, shrinks the work every handler competes with.
Expected result: processingDuration for that target drops in the RUM beacons.
Recovery note: remove the transition wrapper and state updates run synchronously again.
Step 7. Cut presentation delay
Reduce the rendering and layout work the browser does for the frame after your callback finishes.
Skip rendering offscreen sections until they near the viewport:
.below-fold-section {
  content-visibility: auto;
  contain-intrinsic-size: auto 600px; /* reserve space to avoid scroll jumps */
}
Avoid layout thrashing by batching all DOM reads before any writes:
// Read first
const widths = rows.map((row) => row.offsetWidth);
// Then write, so the browser computes layout once
rows.forEach((row, i) => {
  row.style.width = widths[i] + 'px';
});
Expected result:
- presentationDelay drops in RUM.
- LoAF reports shorter style and layout segments for the interaction.
Recovery note: remove the content-visibility rule if reserved sizing causes visible scroll jumps.
Step 8. Roll out behind a flag and re-measure
Ship the fix to a slice of traffic so you can compare cohorts before committing the page to it.
// Tag every beacon with its cohort so RUM can compare like for like
const cohort = flags.inpFix ? 'fix' : 'control';
onINP(({value, attribution}) => {
  navigator.sendBeacon('/rum', JSON.stringify({cohort, value, ...attribution}));
});
Expected result:
- The 'fix' cohort p75 INP sits at or below 200 ms while 'control' stays flat.
- After full rollout, the CrUX p75 from Step 1 trends down over the following weeks.
Recovery note: flip the flag off to route all traffic back to the control path instantly.
Verify
Confirm the change moved the metric, not just the lab trace:
- RUM p75 INP for the fixed interactionTarget is at or below 200 ms.
- A fresh DevTools trace under 4x CPU throttle shows no
evententry over 200 ms for that interaction. - LoAF blockingDuration for the interaction is lower than your Step 4 baseline.
- Re-running the Step 1 CrUX query shows p75 trending toward 'good' over the 28-day window.
- PageSpeed Insights reports the INP audit as passed once enough field data accumulates: pagespeed.web.dev.
Rollback
The flag is the fast path. Reverting the code is the durable path.
# Fast: disable the fix for all traffic in your flag service, no deploy needed.

# Durable: revert the commit and redeploy.
git revert <commit-sha>
git push origin main
What rollback does not undo:
- CrUX is a trailing 28-day window, so field data keeps reflecting the change for days after a revert.
- CDN-cached bundles may serve a stale build until their TTL expires; purge the cache to force the swap.
No step here touches server state or data, so nothing is irreversible. The changes are client-side rendering behavior only.
What's next
Apply the same baseline, attribute, fix, verify loop to Largest Contentful Paint and Cumulative Layout Shift. Wire the RUM beacons into a dashboard so INP regressions surface within a deploy rather than after a 28-day CrUX window. If a framework re-render is the recurring cost, the React Compiler tracker shows whether automatic memoization is ready for your stack.